Reading volume alongside price
On this page
Price shows where the market went. Volume shows how many units changed hands on the way. Read together, they help you judge whether a move has broad participation or is running on thin trade.
What volume measures
Volume is the amount of an asset traded in a period — one candle, one day. On a chart it is usually drawn as bars under the price. In crypto, each exchange reports its own volume, so the number you see depends on where the data comes from. Compare volume on the same exchange and timeframe, not across platforms.
Volume and breakouts
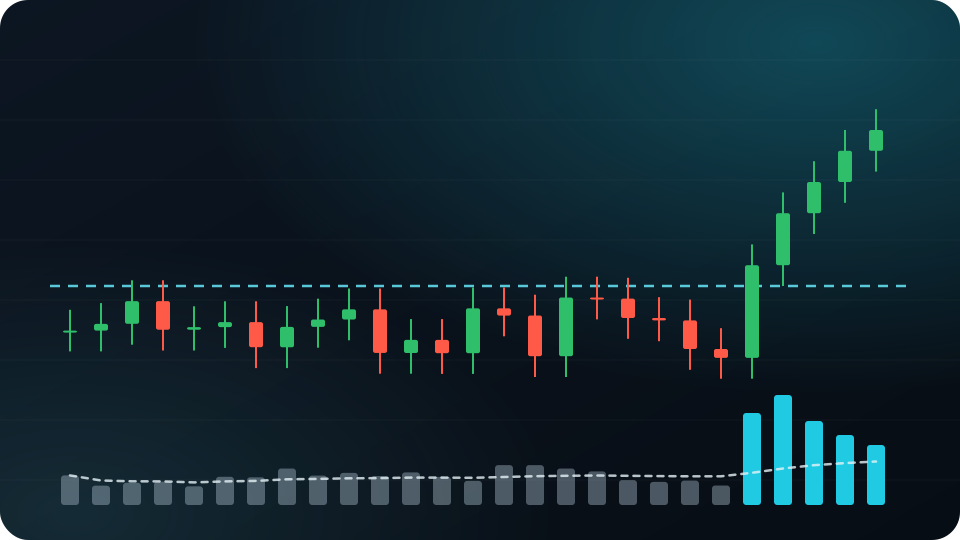
A breakout through resistance on volume clearly above its recent average suggests many participants agreed with the move. A breakout on low volume is easier to reverse, because fewer orders support the new price.
A practical way to judge "above average" is to compare the breakout candle's volume with a moving average of volume, for example the last 20 candles, rather than eyeballing the bars.
When price and volume disagree
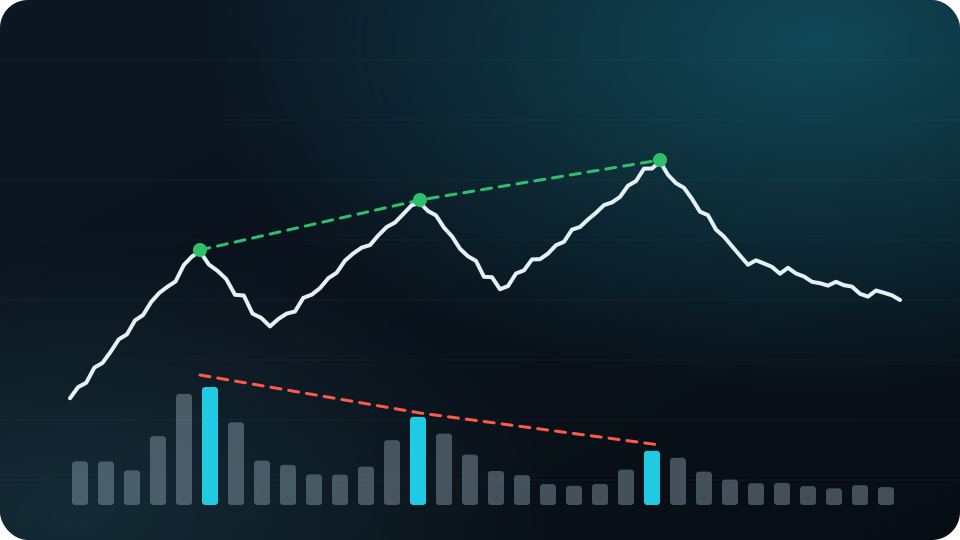
If price keeps making new highs while volume on each push gets smaller, fewer traders are taking part in the advance. This divergence does not mean a reversal is coming. It means the move is getting thinner and deserves a tighter plan.
- Rising price, rising volume — participation is growing.
- Rising price, falling volume — the advance is thinning out.
- Sharp drop on very high volume — often forced selling or liquidations; volatility usually stays high for a while.
Volume at support and resistance
Volume adds context at the zones you have already marked. A test of support on shrinking volume suggests sellers are running out of interest. A test on heavy volume that still holds shows buyers absorbing real supply. A break of the zone on heavy volume is harder to dismiss than one on a quiet weekend.
In every case, volume is a second opinion on the price action, not a replacement for it. Decide your entry, stop and target from the chart, then use volume to judge how much confidence the setup deserves.
Limits
Volume on crypto exchanges can include wash trading, especially on smaller venues and low-liquidity coins. Weekend and holiday volume is naturally lower. And volume says nothing about direction by itself: every trade has a buyer and a seller.
For education only, not financial advice. Trading with leverage or futures can lose more than your margin. All examples are illustrative.
Get the next guide in your inbox
One practical email a week. Free, unsubscribe anytime.
Or follow Tradevo on TelegramMarket now
Latest news